Linear Regression is one of the most fundamental algorithms in the Machine Learning world. It is the door to the magical world ahead.
What is Regression Analysis?
Regression in statistics is the process of predicting a Label(or Dependent Variable) based on the features(Independent Variables) at hand.
Simple Linear Regression
Simple Linear regression is a method for predicting a quantitative response using a single feature (“input variable”). The mathematical equation is:
y = b + m*x
What do terms represent?
y is the response or the target variablex is the featurem is the coefficient of xb is the intercept
b and m are the model coefficients. To create a model, we must “learn” the values of these coefficients. And once we have the value of these coefficients, we can use the model to predict the output
Estimating (“Learning”) Model Coefficients
The coefficients are estimated using the least-squares criterion, i.e., the best fit line has to be calculated that minimizes the sum of squared residuals (or “sum of squared errors”).
The mathematics involved
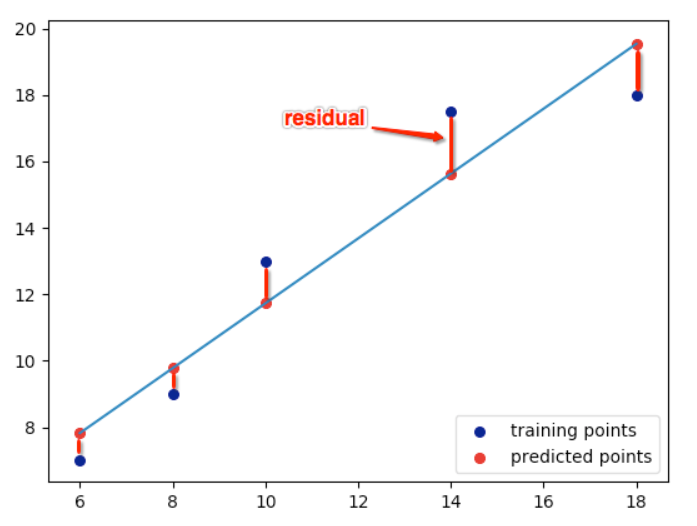
Take a quick look at the plot created. Now consider each point, and know that each of them has a coordinate in the form (X, Y). Now draw an imaginary line between each point and the current “best-fit” line. We’ll call the distance between each point and the current best-fit line as D. To get a quick image of what we’re trying to visualize, take a look at the picture below:

What elements are present in the diagram?
- The red points are the observed values of x and y.
- The blue line is the least squares line.
- The green lines are the residuals, which is the distance between the observed values and the least squares line.
The general equation of a straight line is: 𝑦 = m*x + b It means that if we have the value of m and b, we can predict all the values of y for corresponding x. During construction of a Linear Regression Model, the computer tries to calculate the values of m and b to get a straight line. But the question is:
How Do you Know this is the best fit line?
The best fit line is obtained by minimizing the residual. Residual is the distance between the actual Y and the predicted Y, as shown below:
Mathematically, Residual is: y = m*x + b Hence, the sum of the square of residuals is:

As we can see that the residual is both a function of m and b, so differentiating partially with respect to m and b will give us:

For getting the best fit line, residual should be minimum. The minima of a function occurs where the derivative=0. So, equating our corresponding derivatives to 0, we get:

This same equation can be written in matrix form as:

Ideally, if we’d have an equation of one dependent and one independent variable the minima will look as follows:

But as the residual’s minima is dependent on two variables m and b, it becomes a Paraboloid and the appropriate m and b are calculated using Gradient Descent as shown below:


This conevrgence will take will until it reached to it’s minimum value and give us the most suitable value of cofficients
Happy Coding


Leave a Comment