Confusion Matrix is not so confusing 😂
Let’s dig into it :
In field of machine learning Confusion matrix is often used to visualize the performace of classification algorithm. It is also known as error matrix.
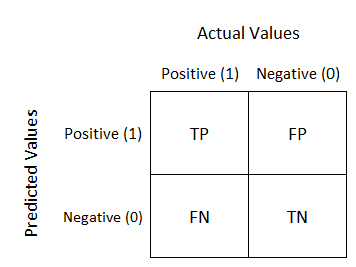
Let’s represent Confusion Matrix
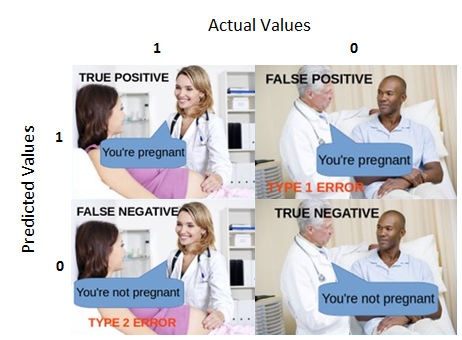
Note:Let we consider a model that predict a person suffering from cancer or not.
Let’s unwrap it :
- TP - TP stand for
true posetivethat means actual data was posetive and our model also predicted posetive.
.eg. If a person was suffering from cancer and model also predicted that person is suffering from cancer then this is called TP - FP - FP stand for
false posetivethat means actual data was negative but our model predicted posetive.
.eg. If a person was not suffering from cancer but our model predicted person is suffering from cancer then this is called FP - FN - FN stand for
false negativethat means actual data was posetive but our model predicted negative.
.eg. If a person was suffering from cancer but our model predicted person is not suffering from cancer then this is called FN - TN - TN stand for
true negativethat means actual data was negative and and our model also predicted negative.
.eg. If a person was not suffering from cancer and our model predicted person is not suffering from cancer then this is called TN
Final Touch
Mathematics and Calculation
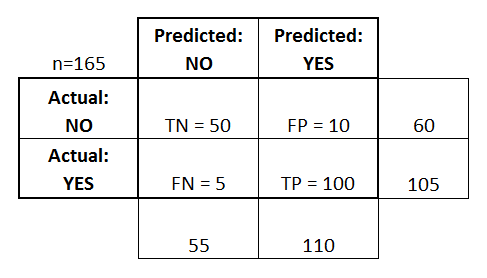
Problem Statement -> Let’s we have total 165 patient they are tested for a disease on posetive or negative scale.
 This is a list of rates that are often computed from a confusion matrix for a binary classifier:
- Accuracy: Overall, how often is the classifier correct?
- (TP+TN)/total = (100+50)/165 = 0.91
- Misclassification Rate: Overall, how often is it wrong?
- (FP+FN)/total = (10+5)/165 = 0.09
- equivalent to 1 minus Accuracy
- also known as “Error Rate”
- True Positive Rate: When it’s actually yes, how often does it predict yes?
- TP/actual yes = 100/105 = 0.95
- also known as “Sensitivity” or “Recall”
- False Positive Rate: When it’s actually no, how often does it predict yes?
- FP/actual no = 10/60 = 0.17
- True Negative Rate: When it’s actually no, how often does it predict no?
- TN/actual no = 50/60 = 0.83
- equivalent to 1 minus False Positive Rate
- also known as “Specificity”
- Precision: When it predicts yes, how often is it correct?
- TP/predicted yes = 100/110 = 0.91
- Prevalence: How often does the yes condition actually occur in our sample? actual yes/total = 105/165 = 0.64
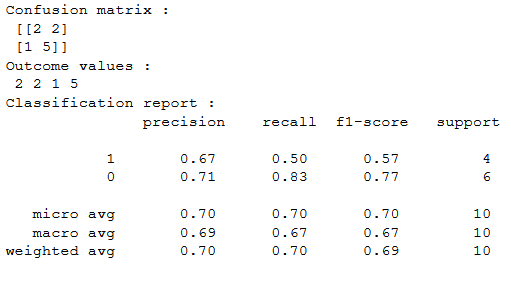
Sample Code
# confusion matrix in sklearn
from sklearn.metrics import confusion_matrix
from sklearn.metrics import classification_report

# actual values
actual = [1,0,0,1,0,0,1,0,0,1]
# predicted values
predicted = [1,0,0,1,0,0,0,1,0,0]

# confusion matrix
matrix = confusion_matrix(actual,predicted, labels=[1,0])
print('Confusion matrix : \n',matrix)

# outcome values order in sklearn
tp, fn, fp, tn = confusion_matrix(actual,predicted,labels=[1,0]).reshape(-1)
print('Outcome values : \n', tp, fn, fp, tn)

# classification report for precision, recall f1-score and accuracy
matrix = classification_report(actual,predicted,labels=[1,0])
print('Classification report : \n',matrix)


Leave a Comment